
COP26: Colours will become darker and darker on the graph as the world gets hotter; says Prof Ed Hawkins
Category: Article
Published: 19th Nov 2021
Words: Design City Team
Images: Show Your Stripes
Location: United Kingdom
Year: 2021
People: Ed Hawkins
Tags: Climate Change

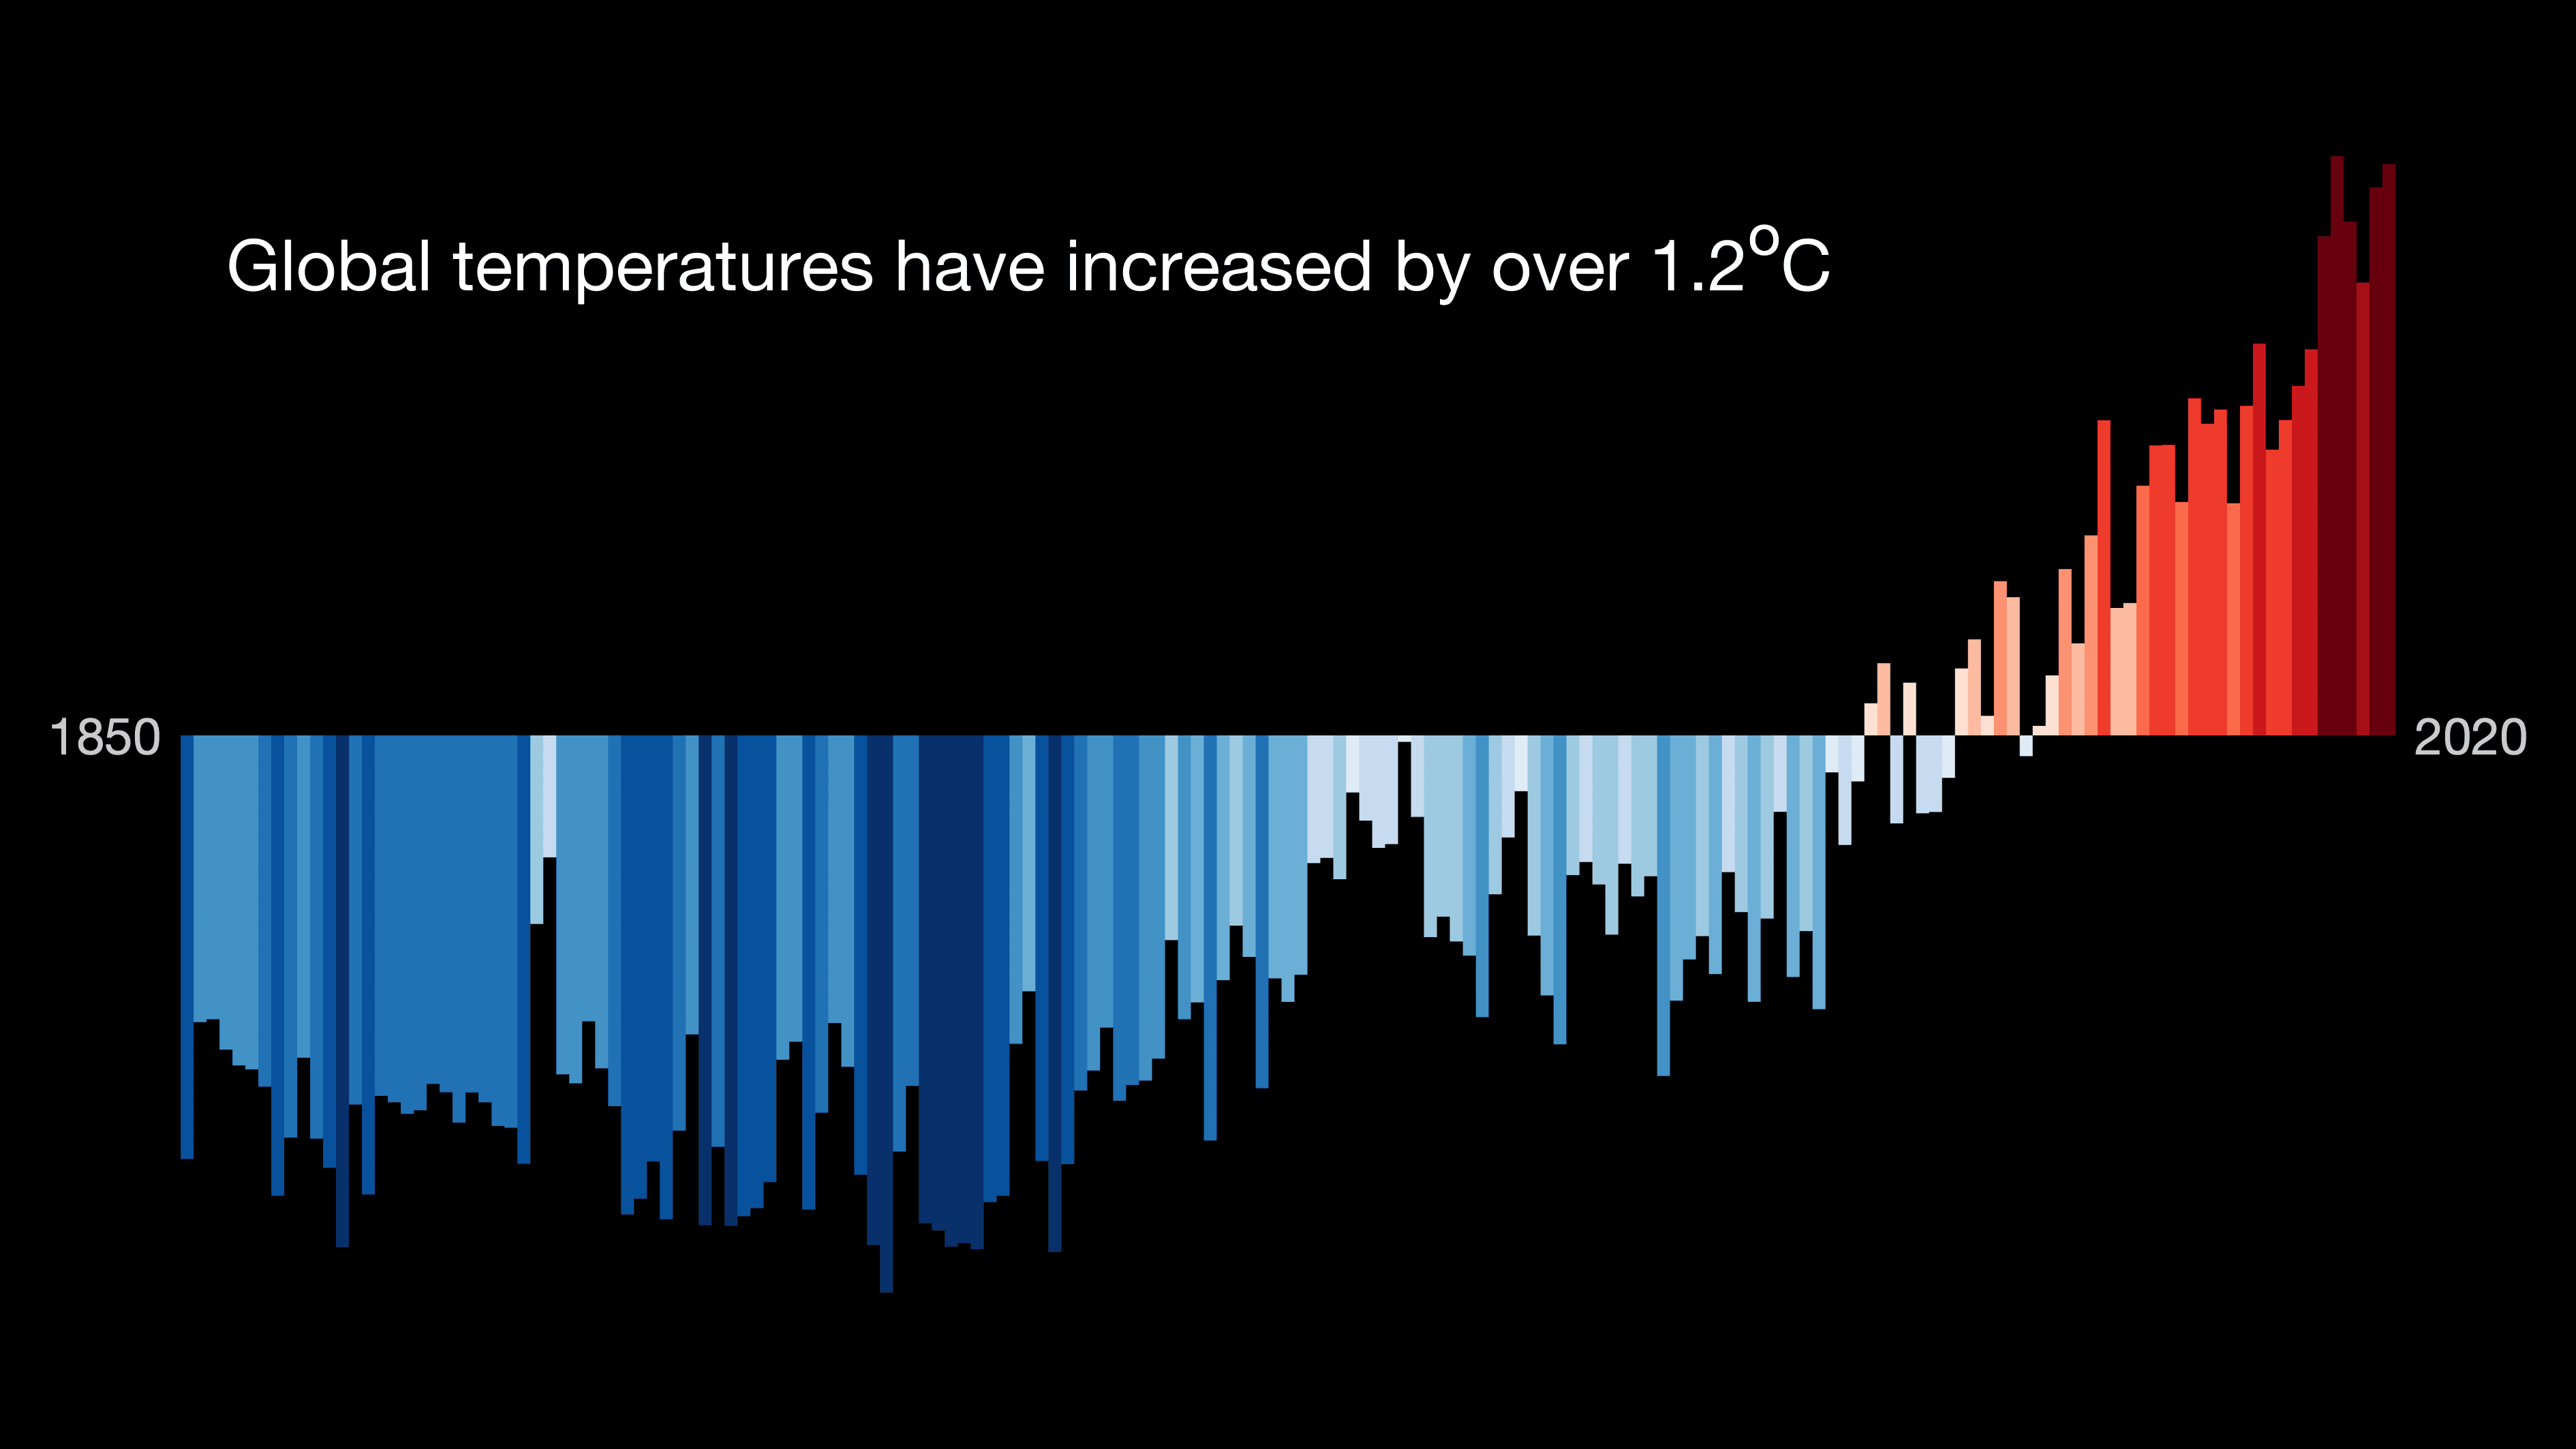
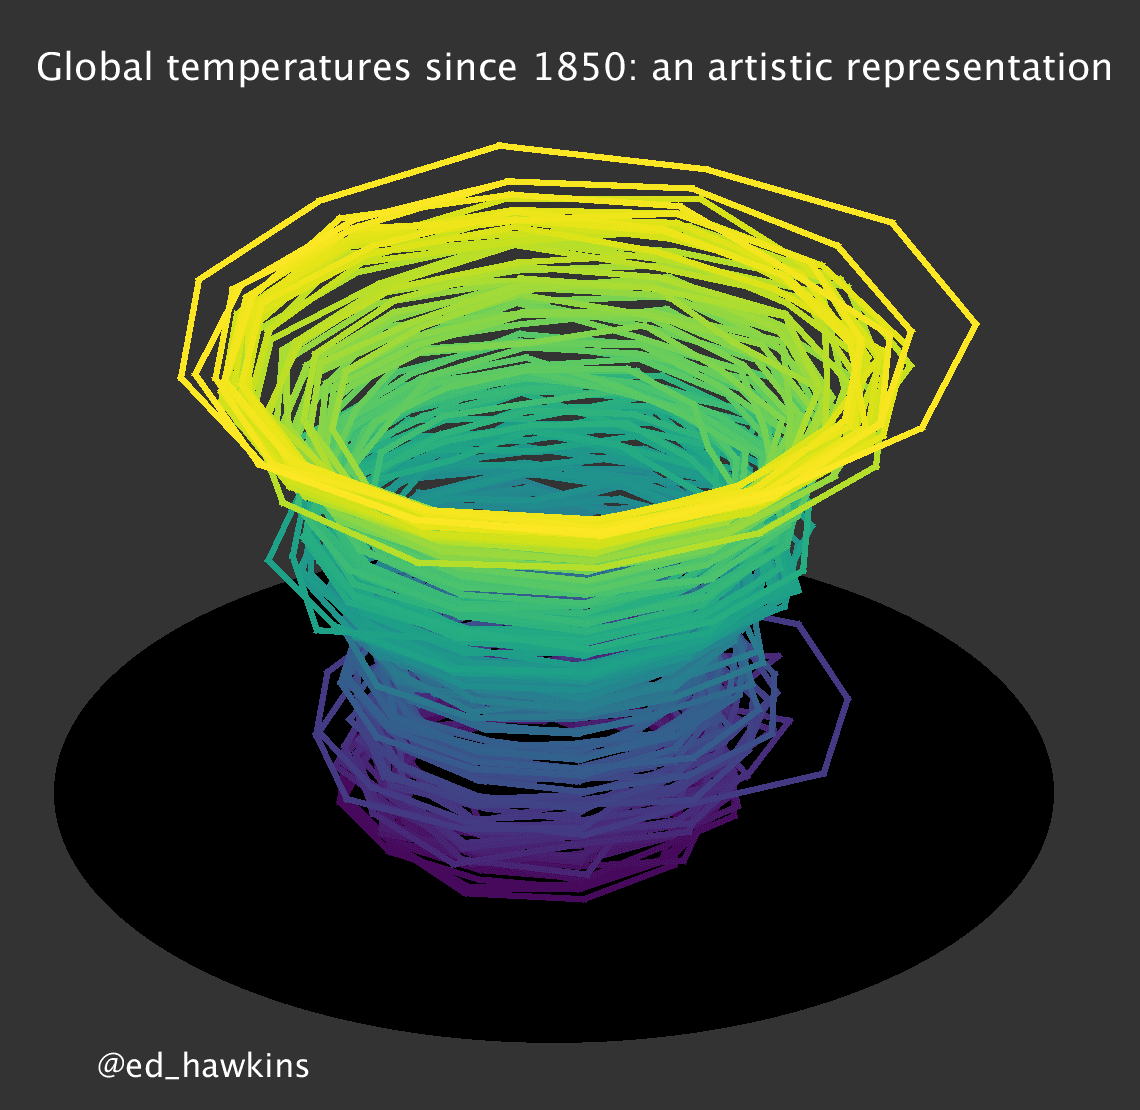
Warming stripes (also referred to as climate stripes) are a set of 170 vertical-coloured bars, graphically visualising how global average temperature has risen over nearly two centuries.
Seen as a symbol for climate change, the warming stripes was created in 2018 by Professor Ed Hawkins at the University of Reading, with each line in the graph representing the average global temperature. The blue stripes represent cooler years and the red represent hotter-than-average years.
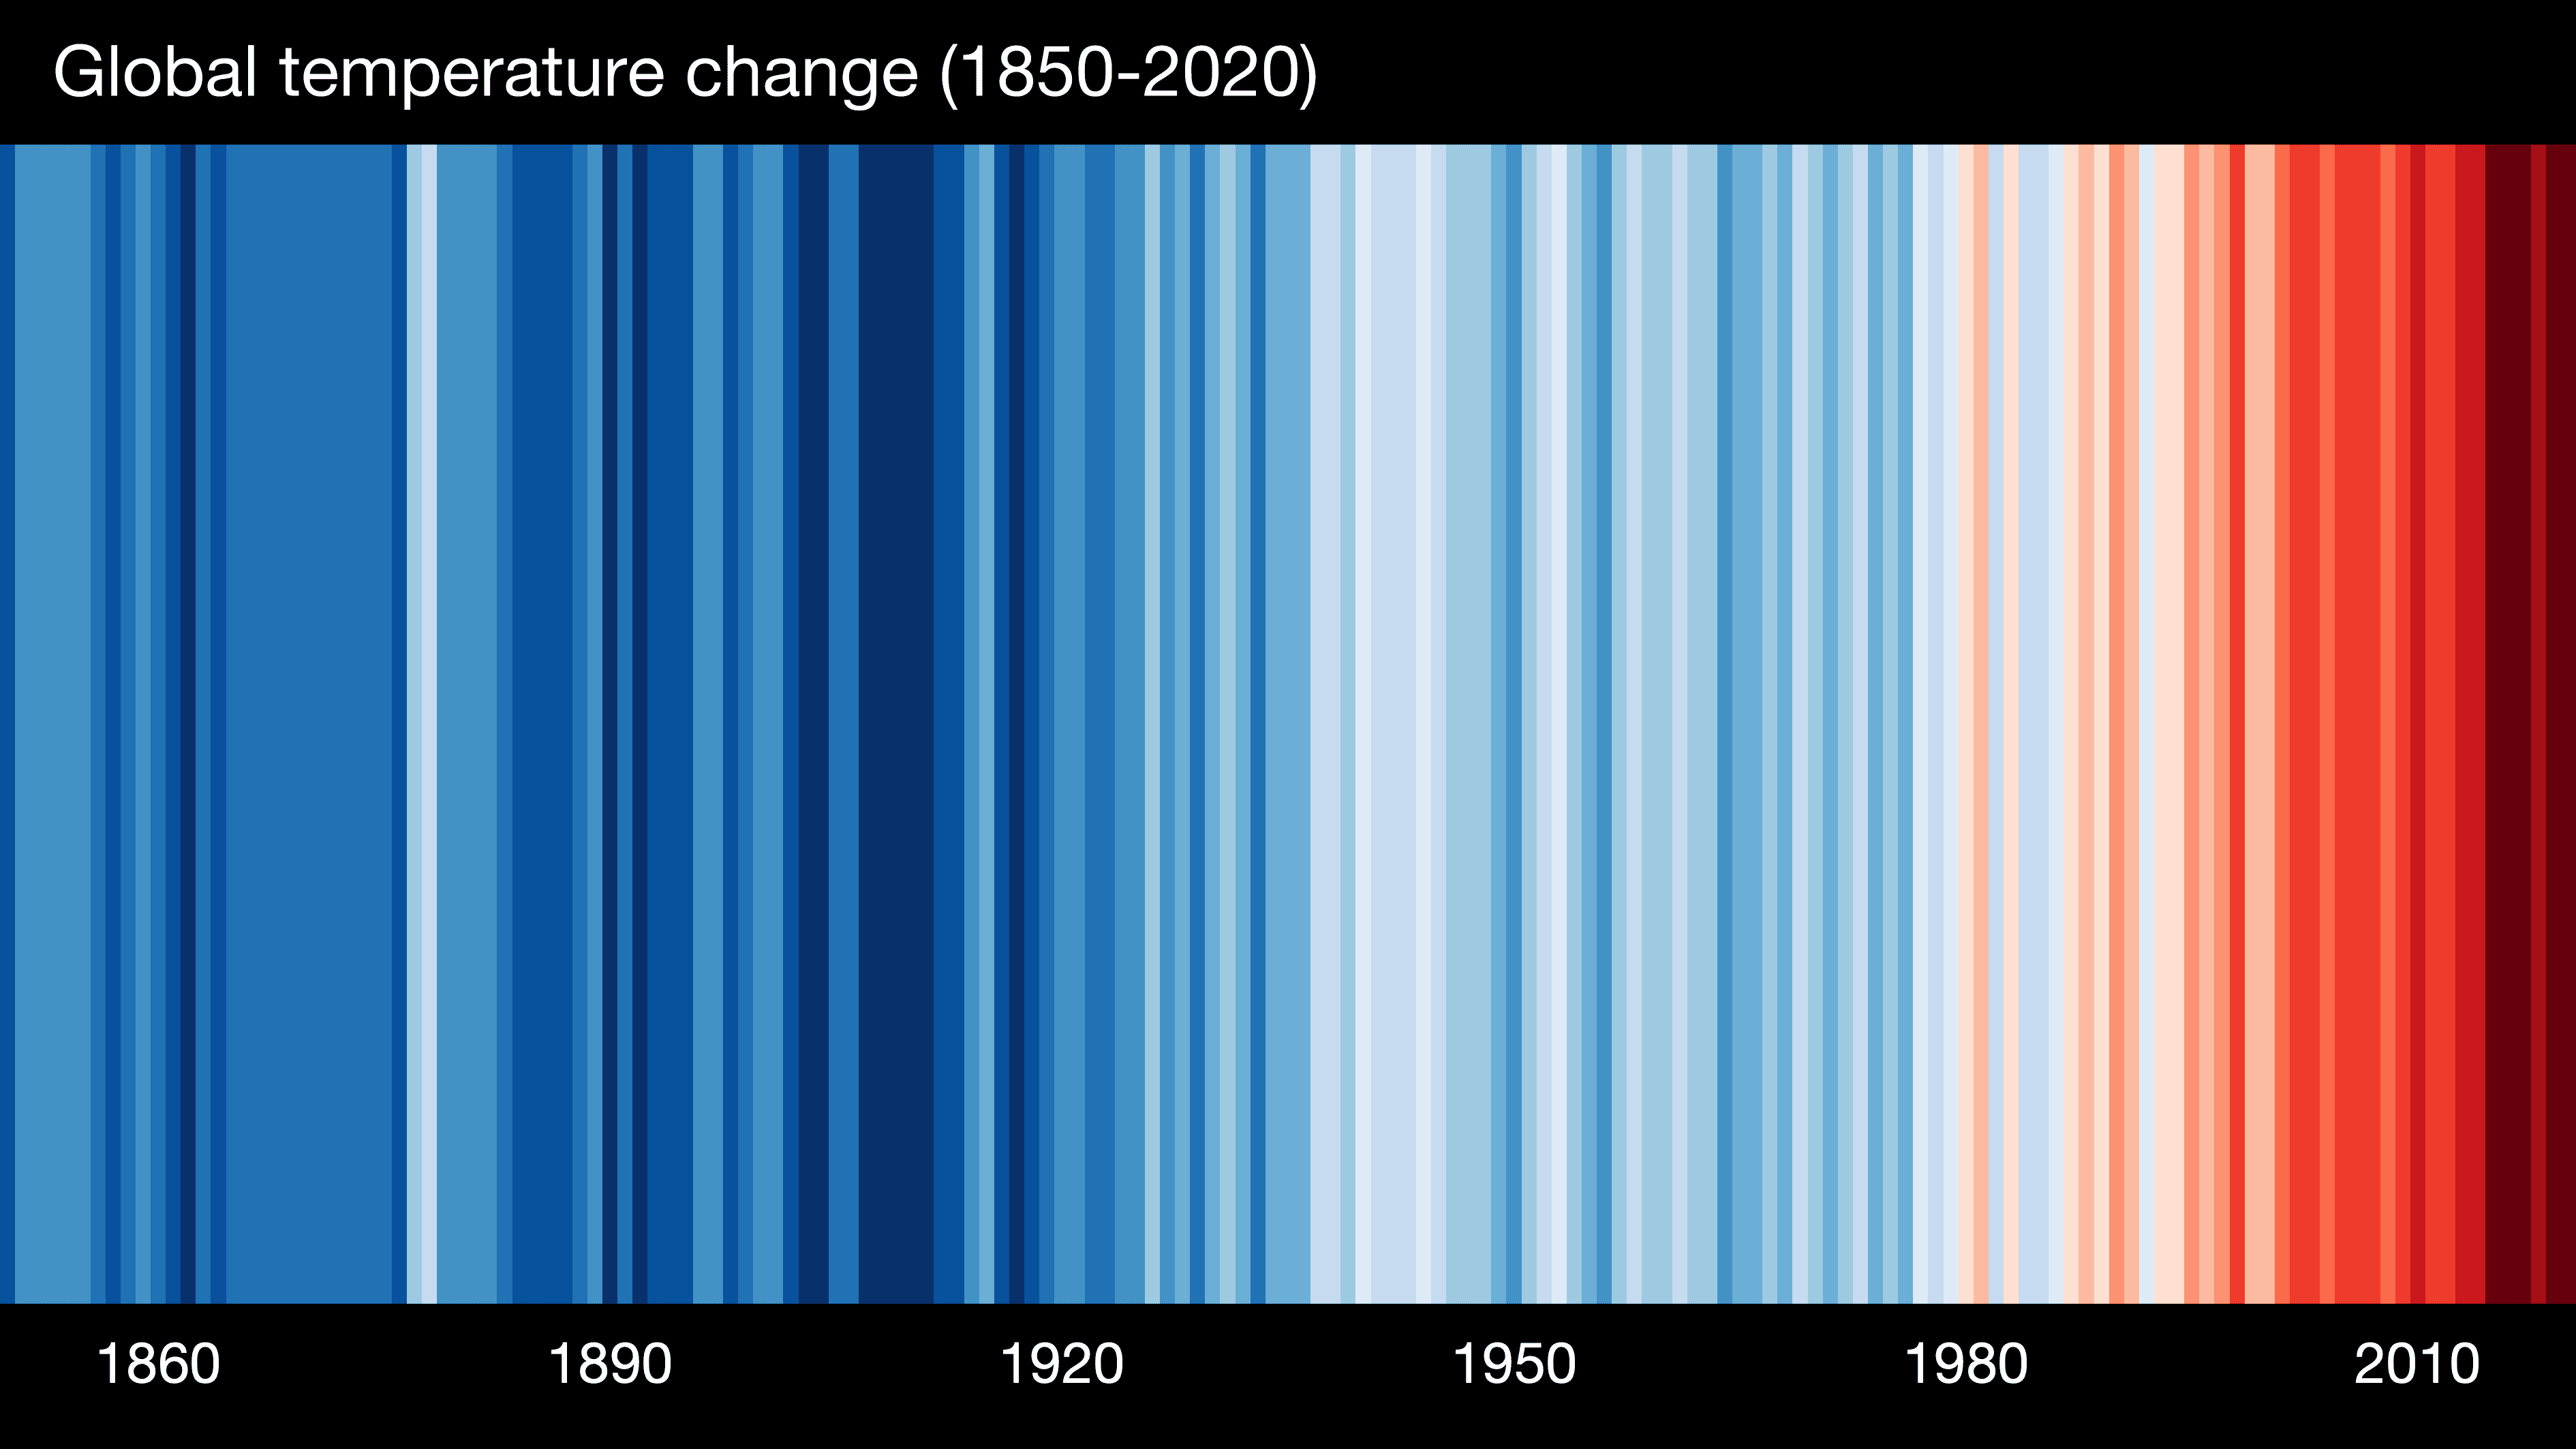
Reflecting on the COP26, the climate summit, Hawkins said ‘Colours will just get darker’. He said he would be needing more colours to represent the rising temperatures around the world.
The warming stripes are now available for every country in the world at 'show your stripes' since every country is warming differently. People are able to instantly visualise how climate change is increasing the average temperature of their country, over the years.
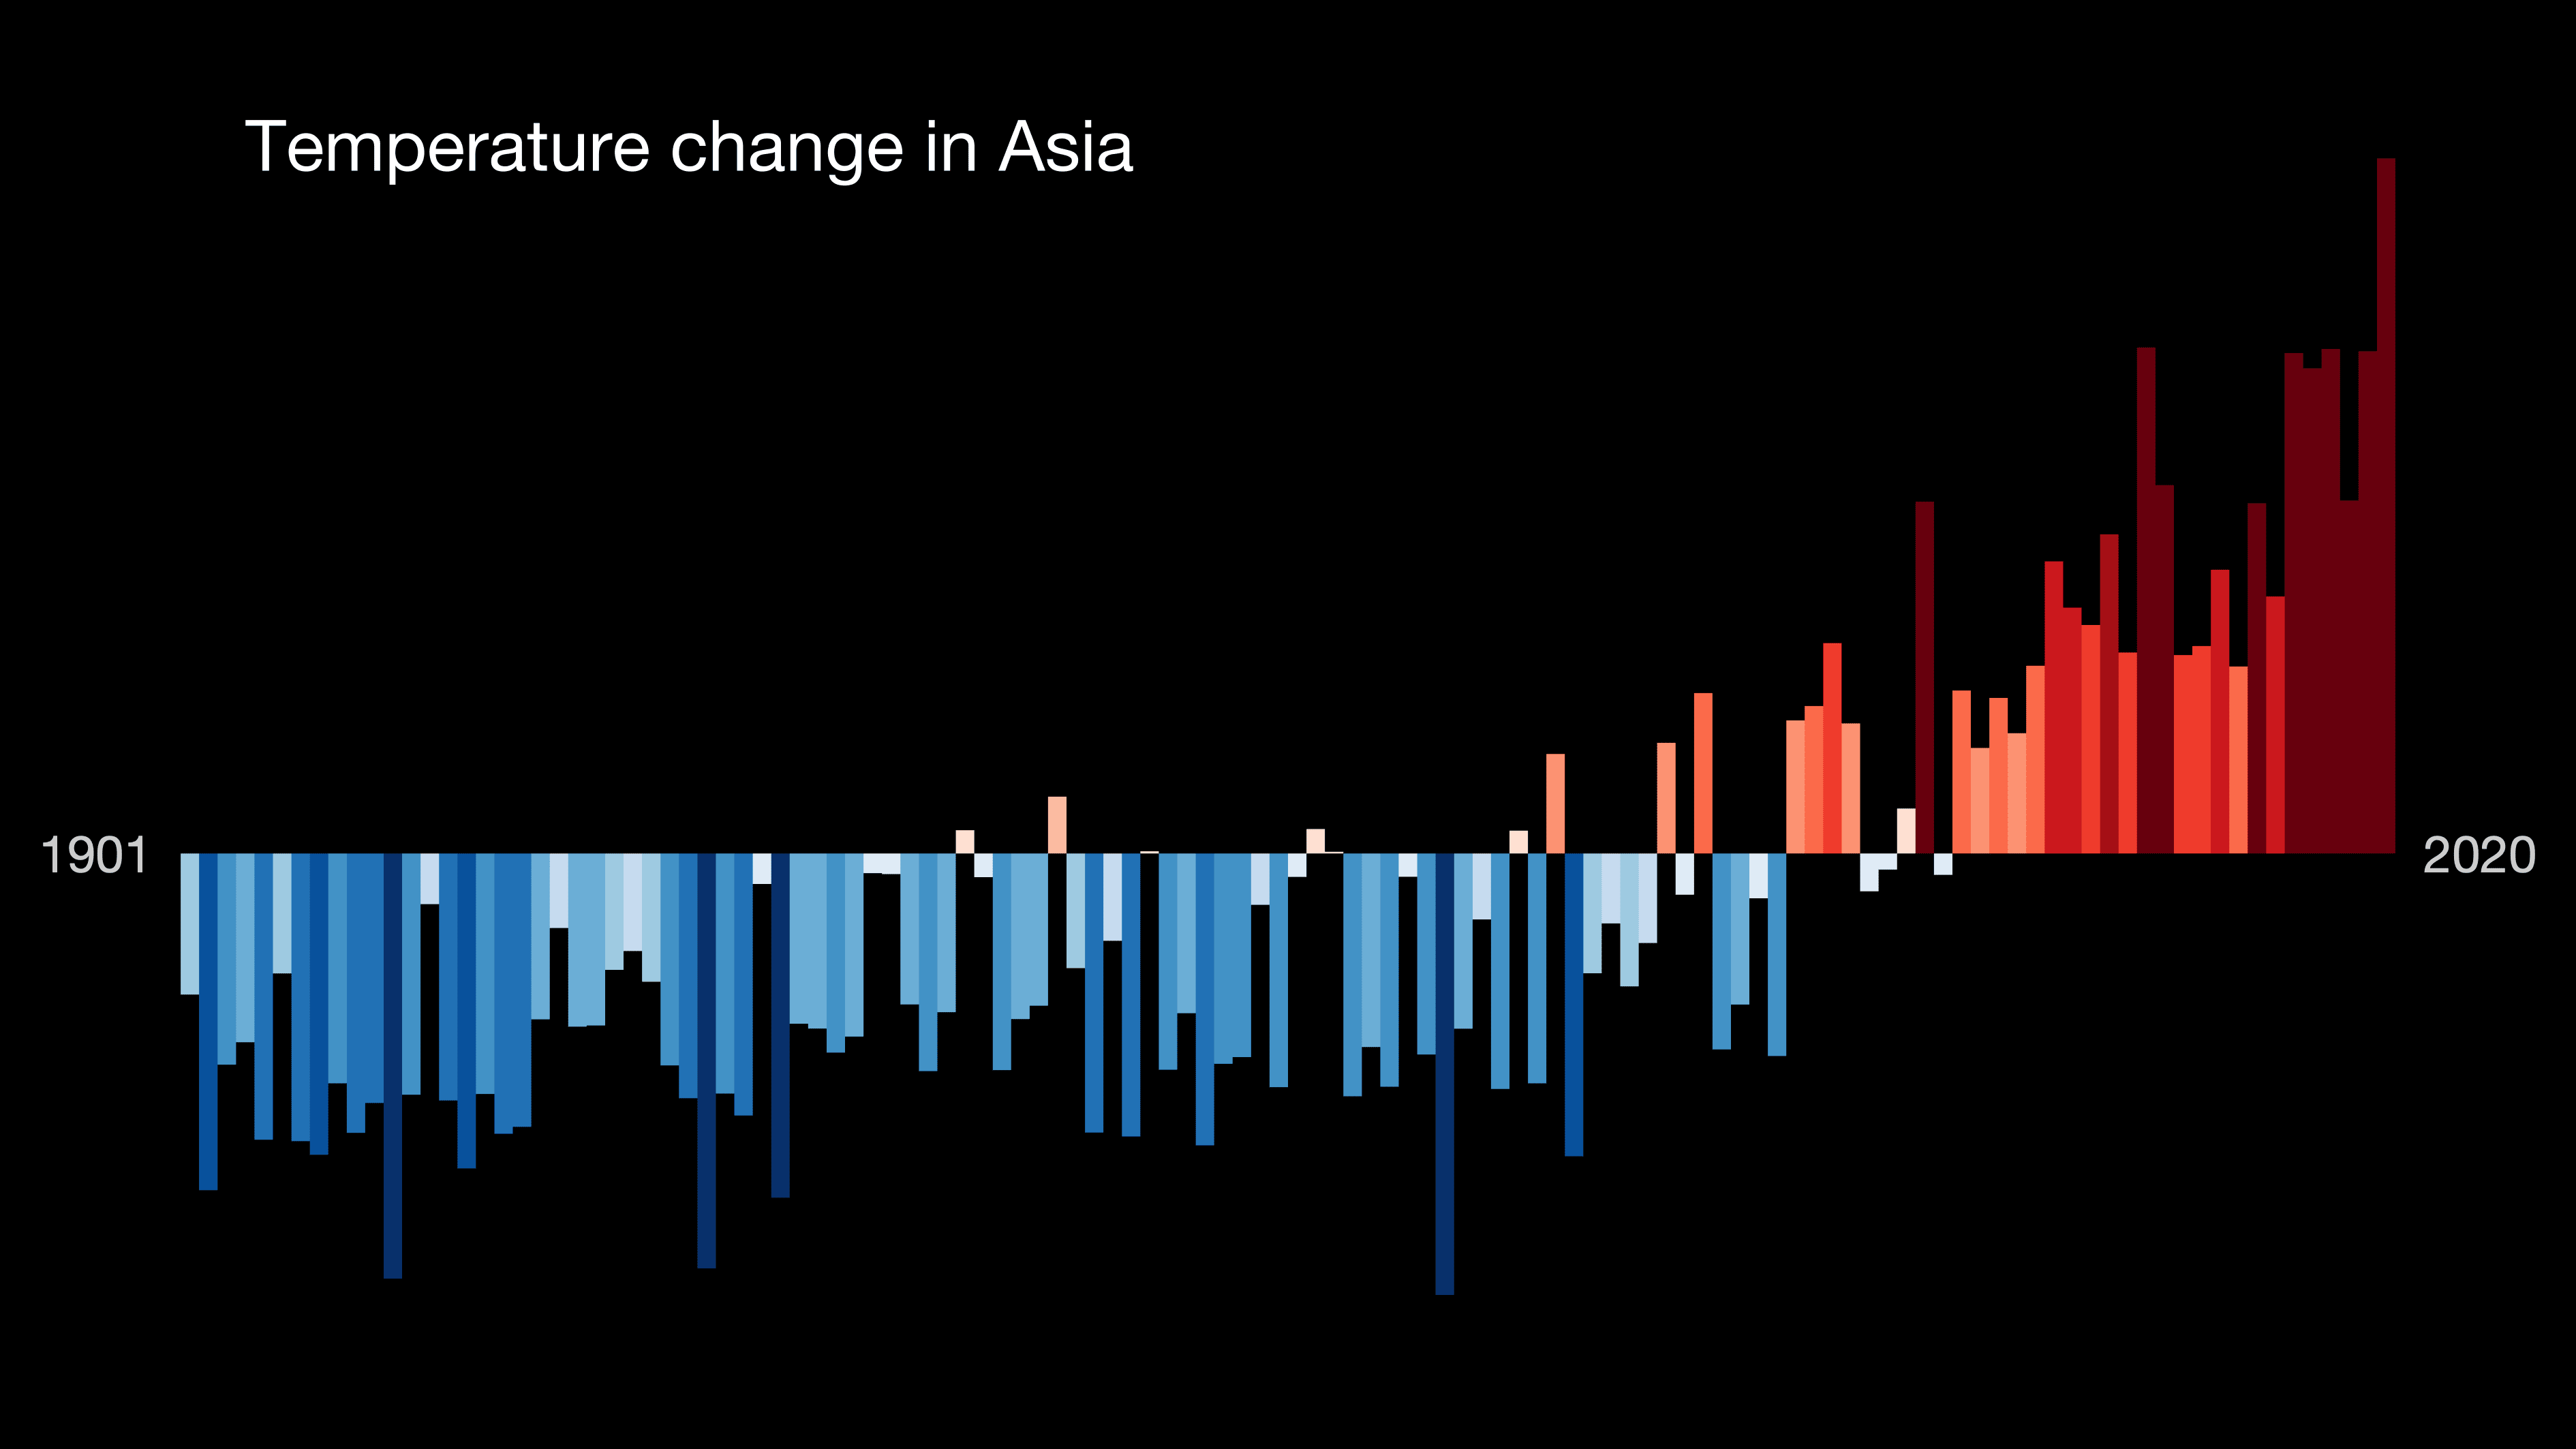
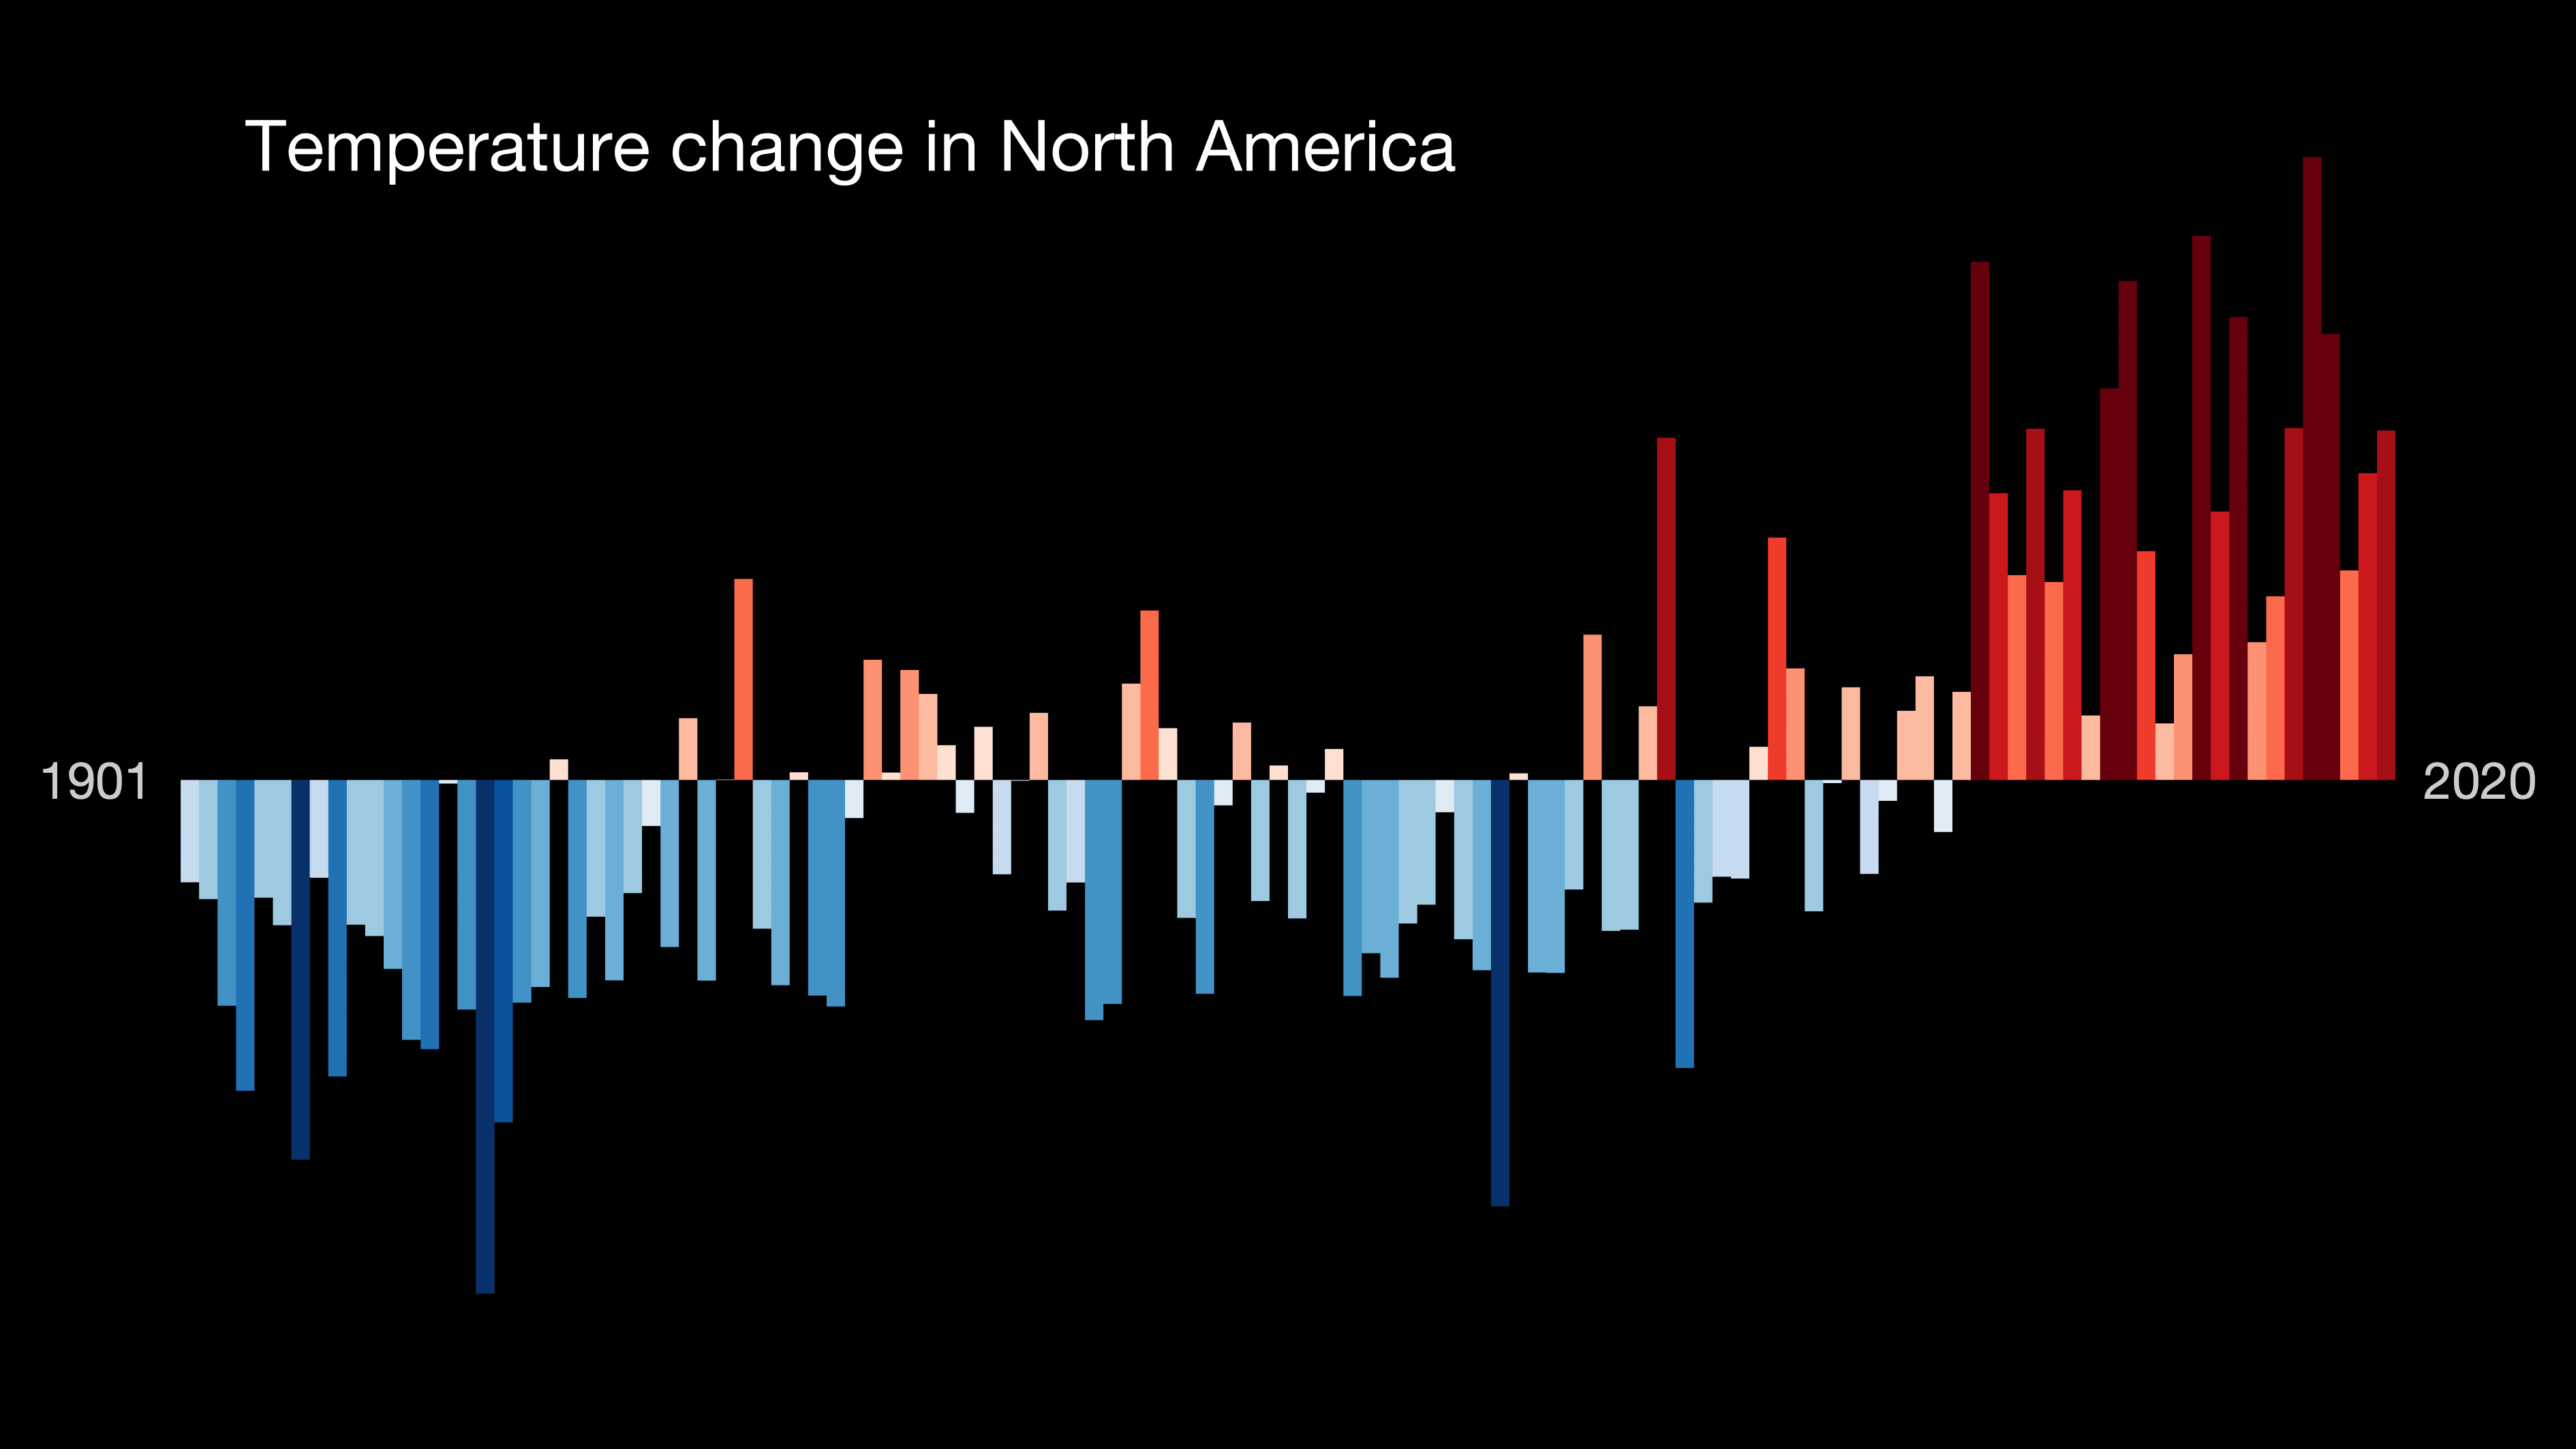
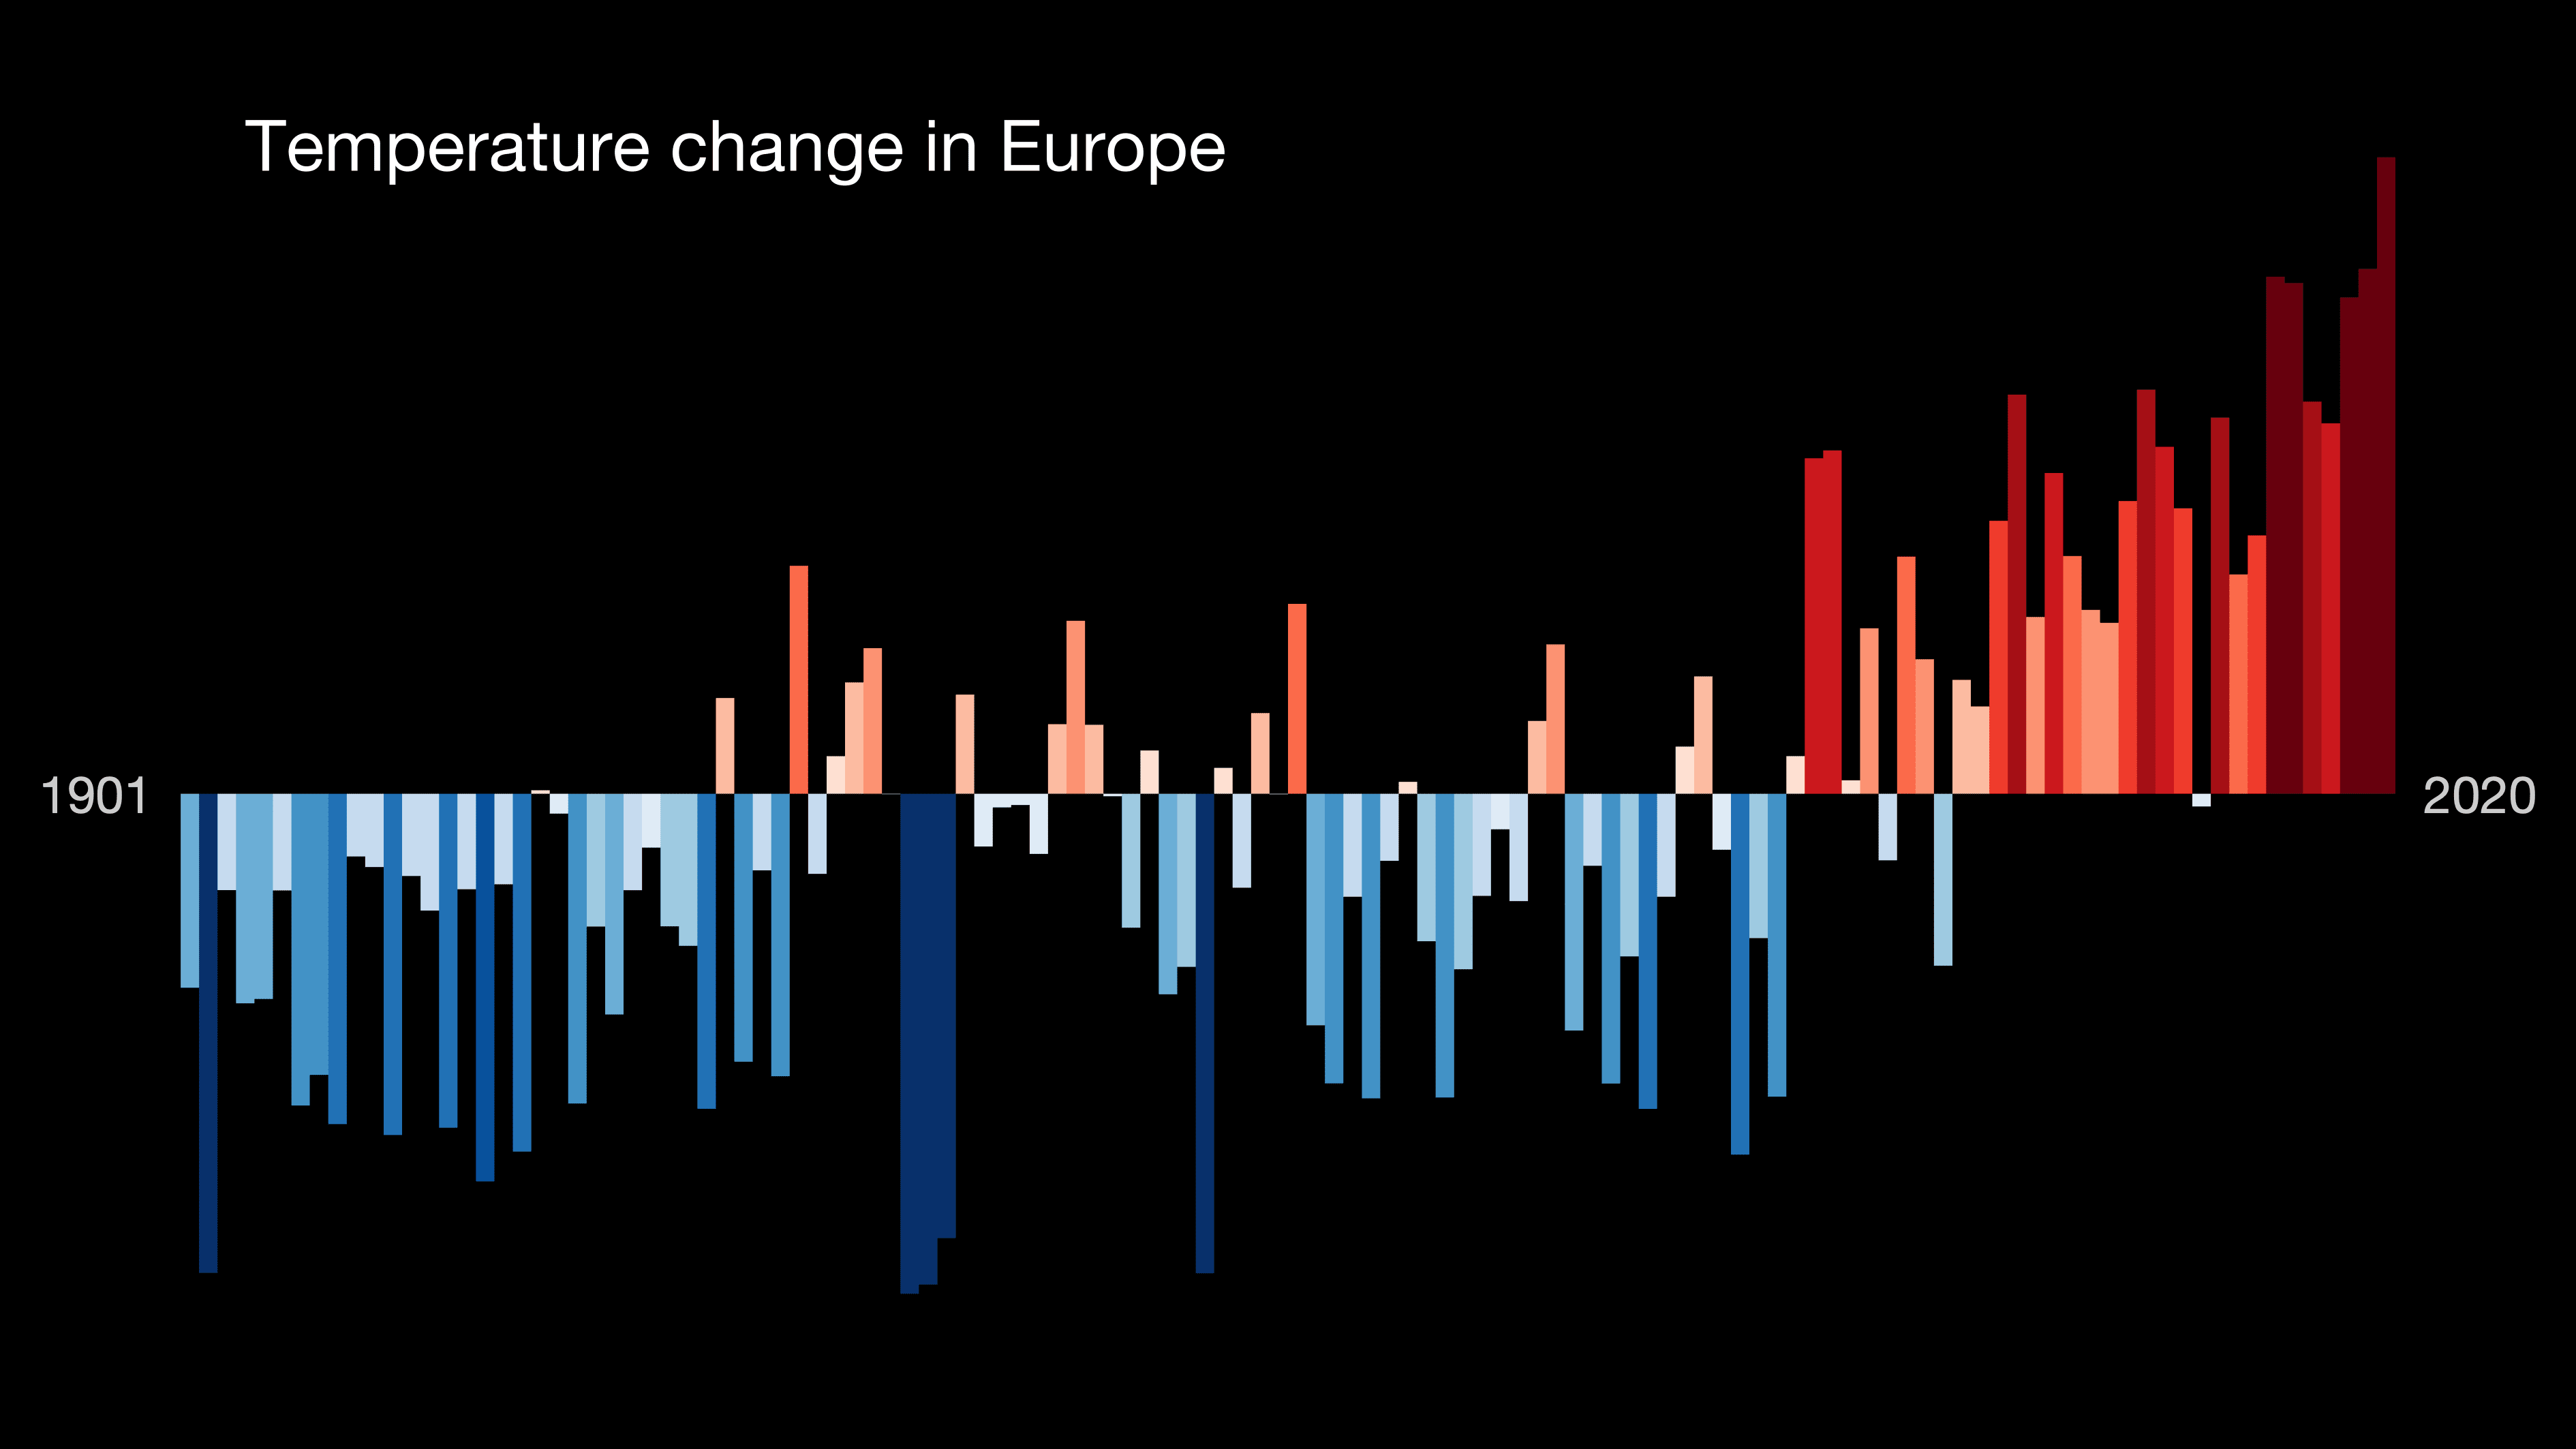
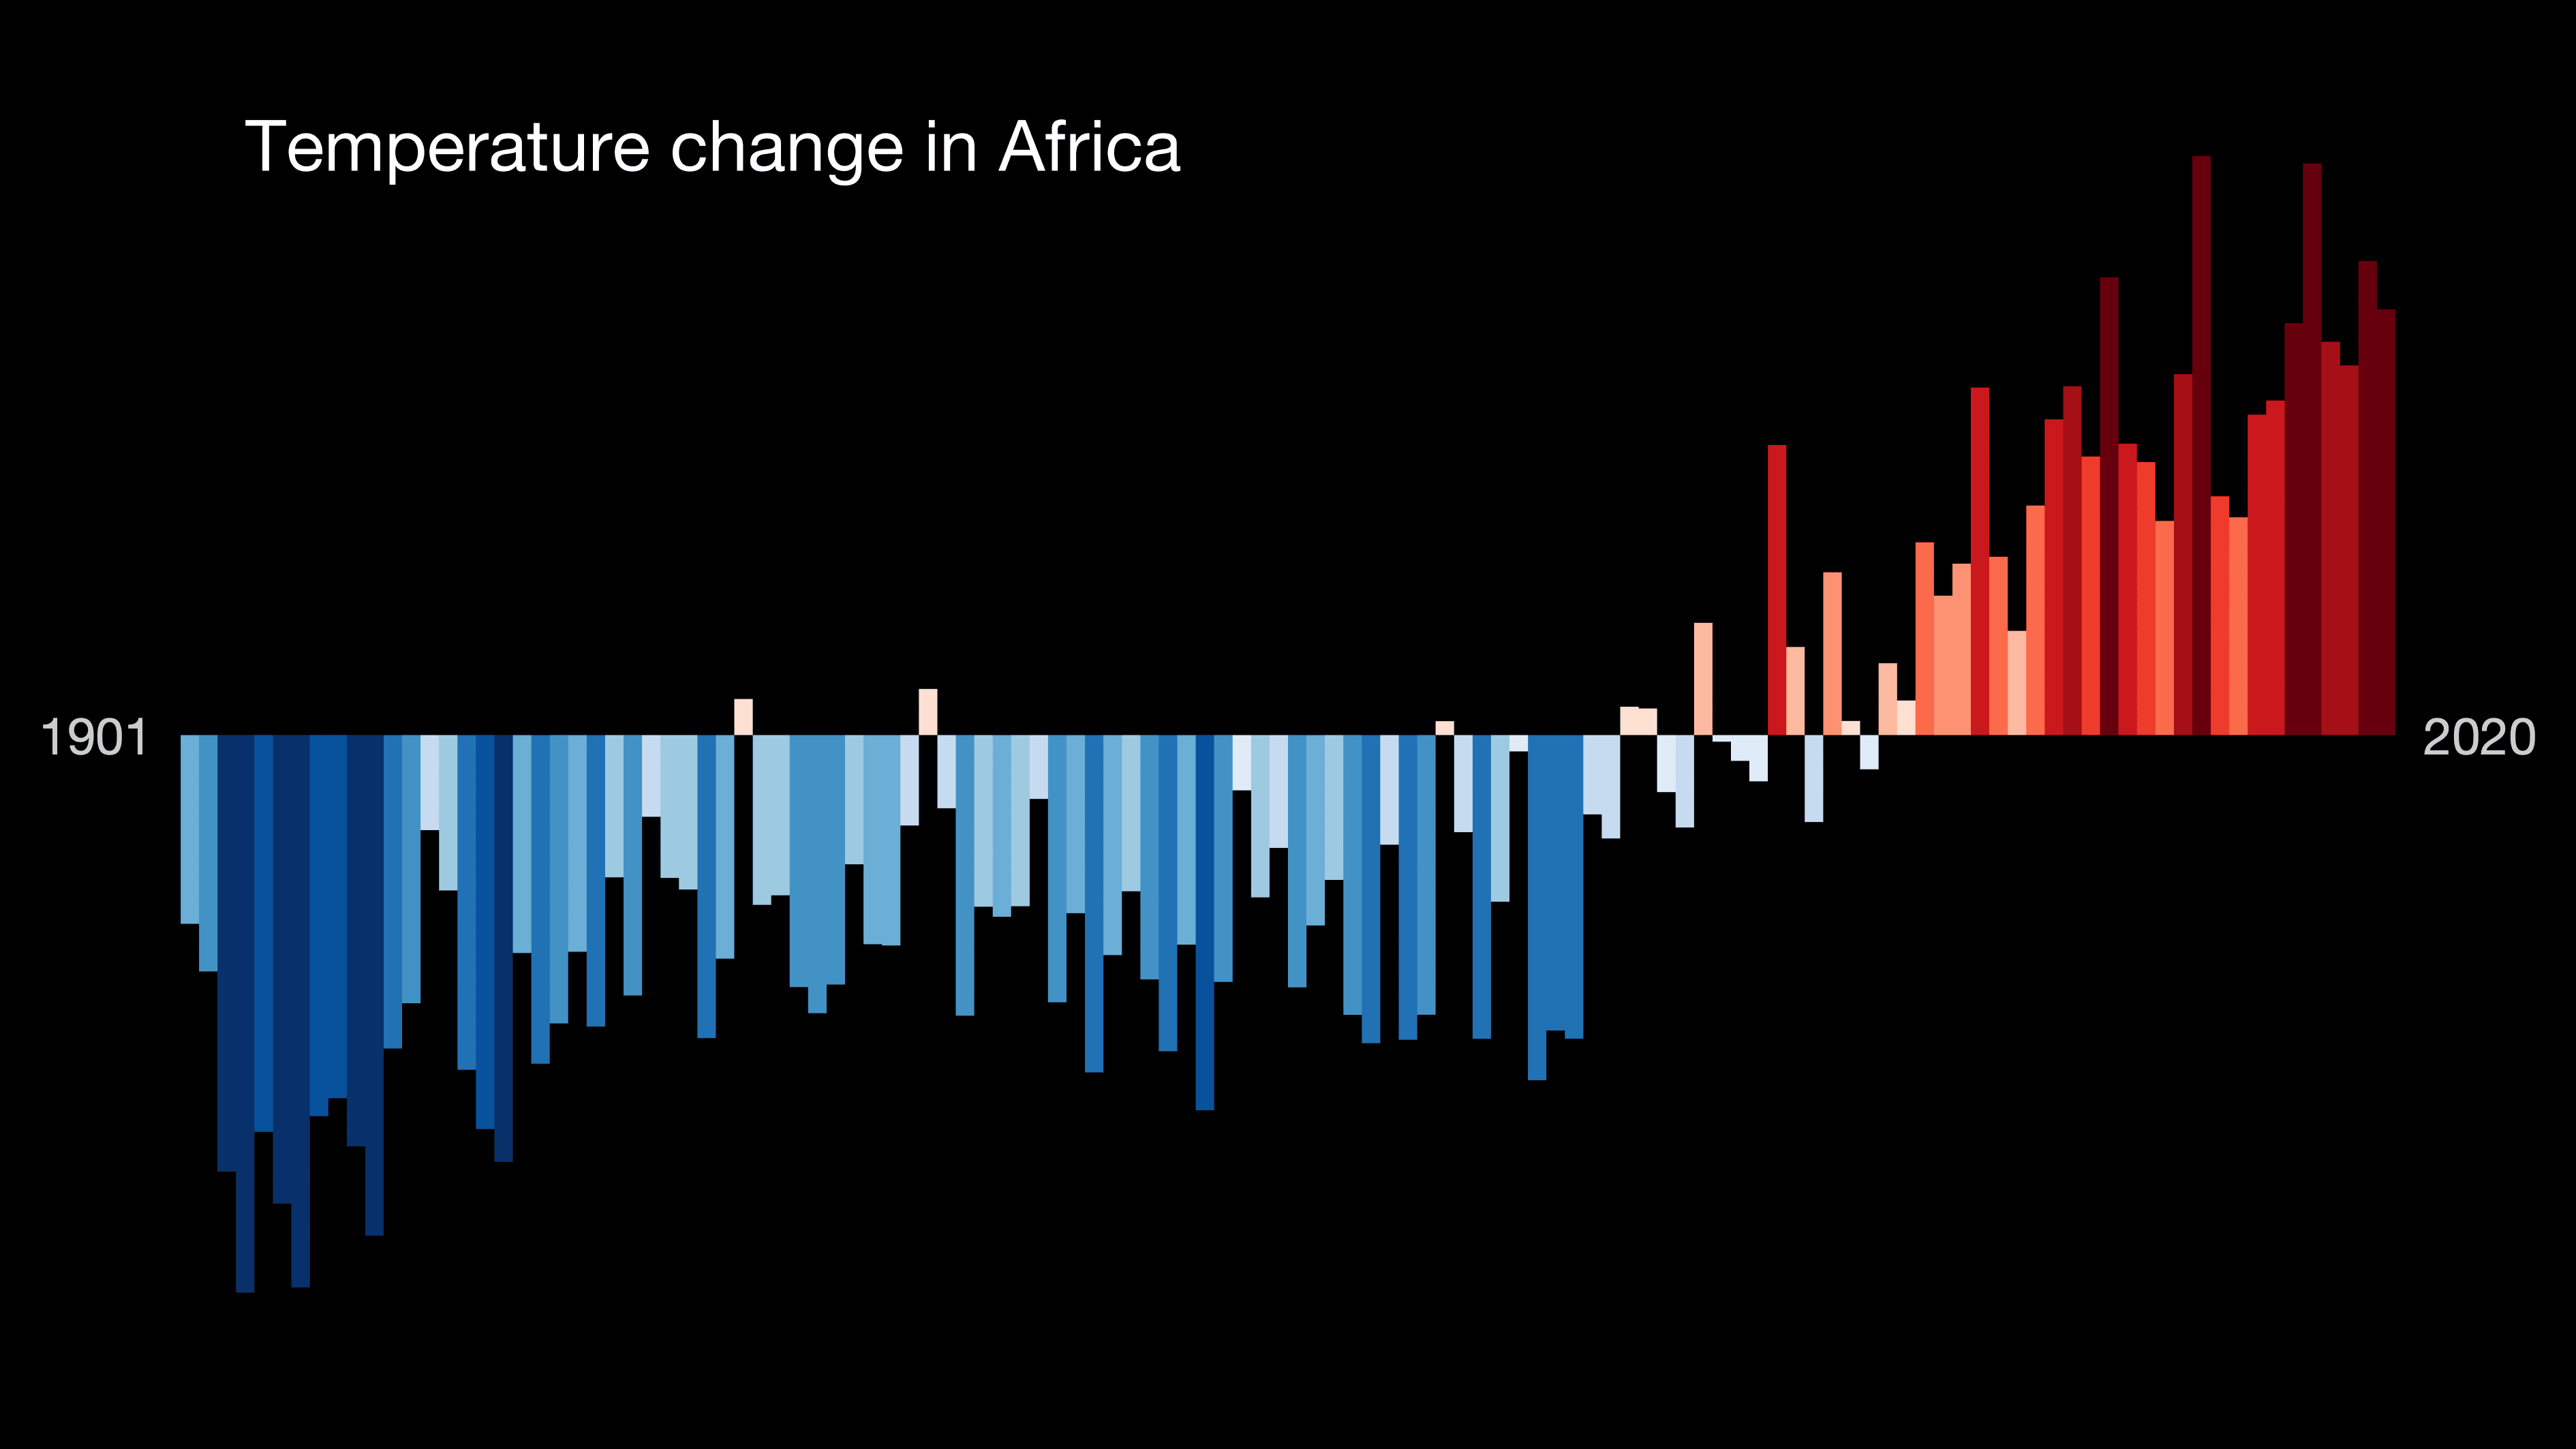
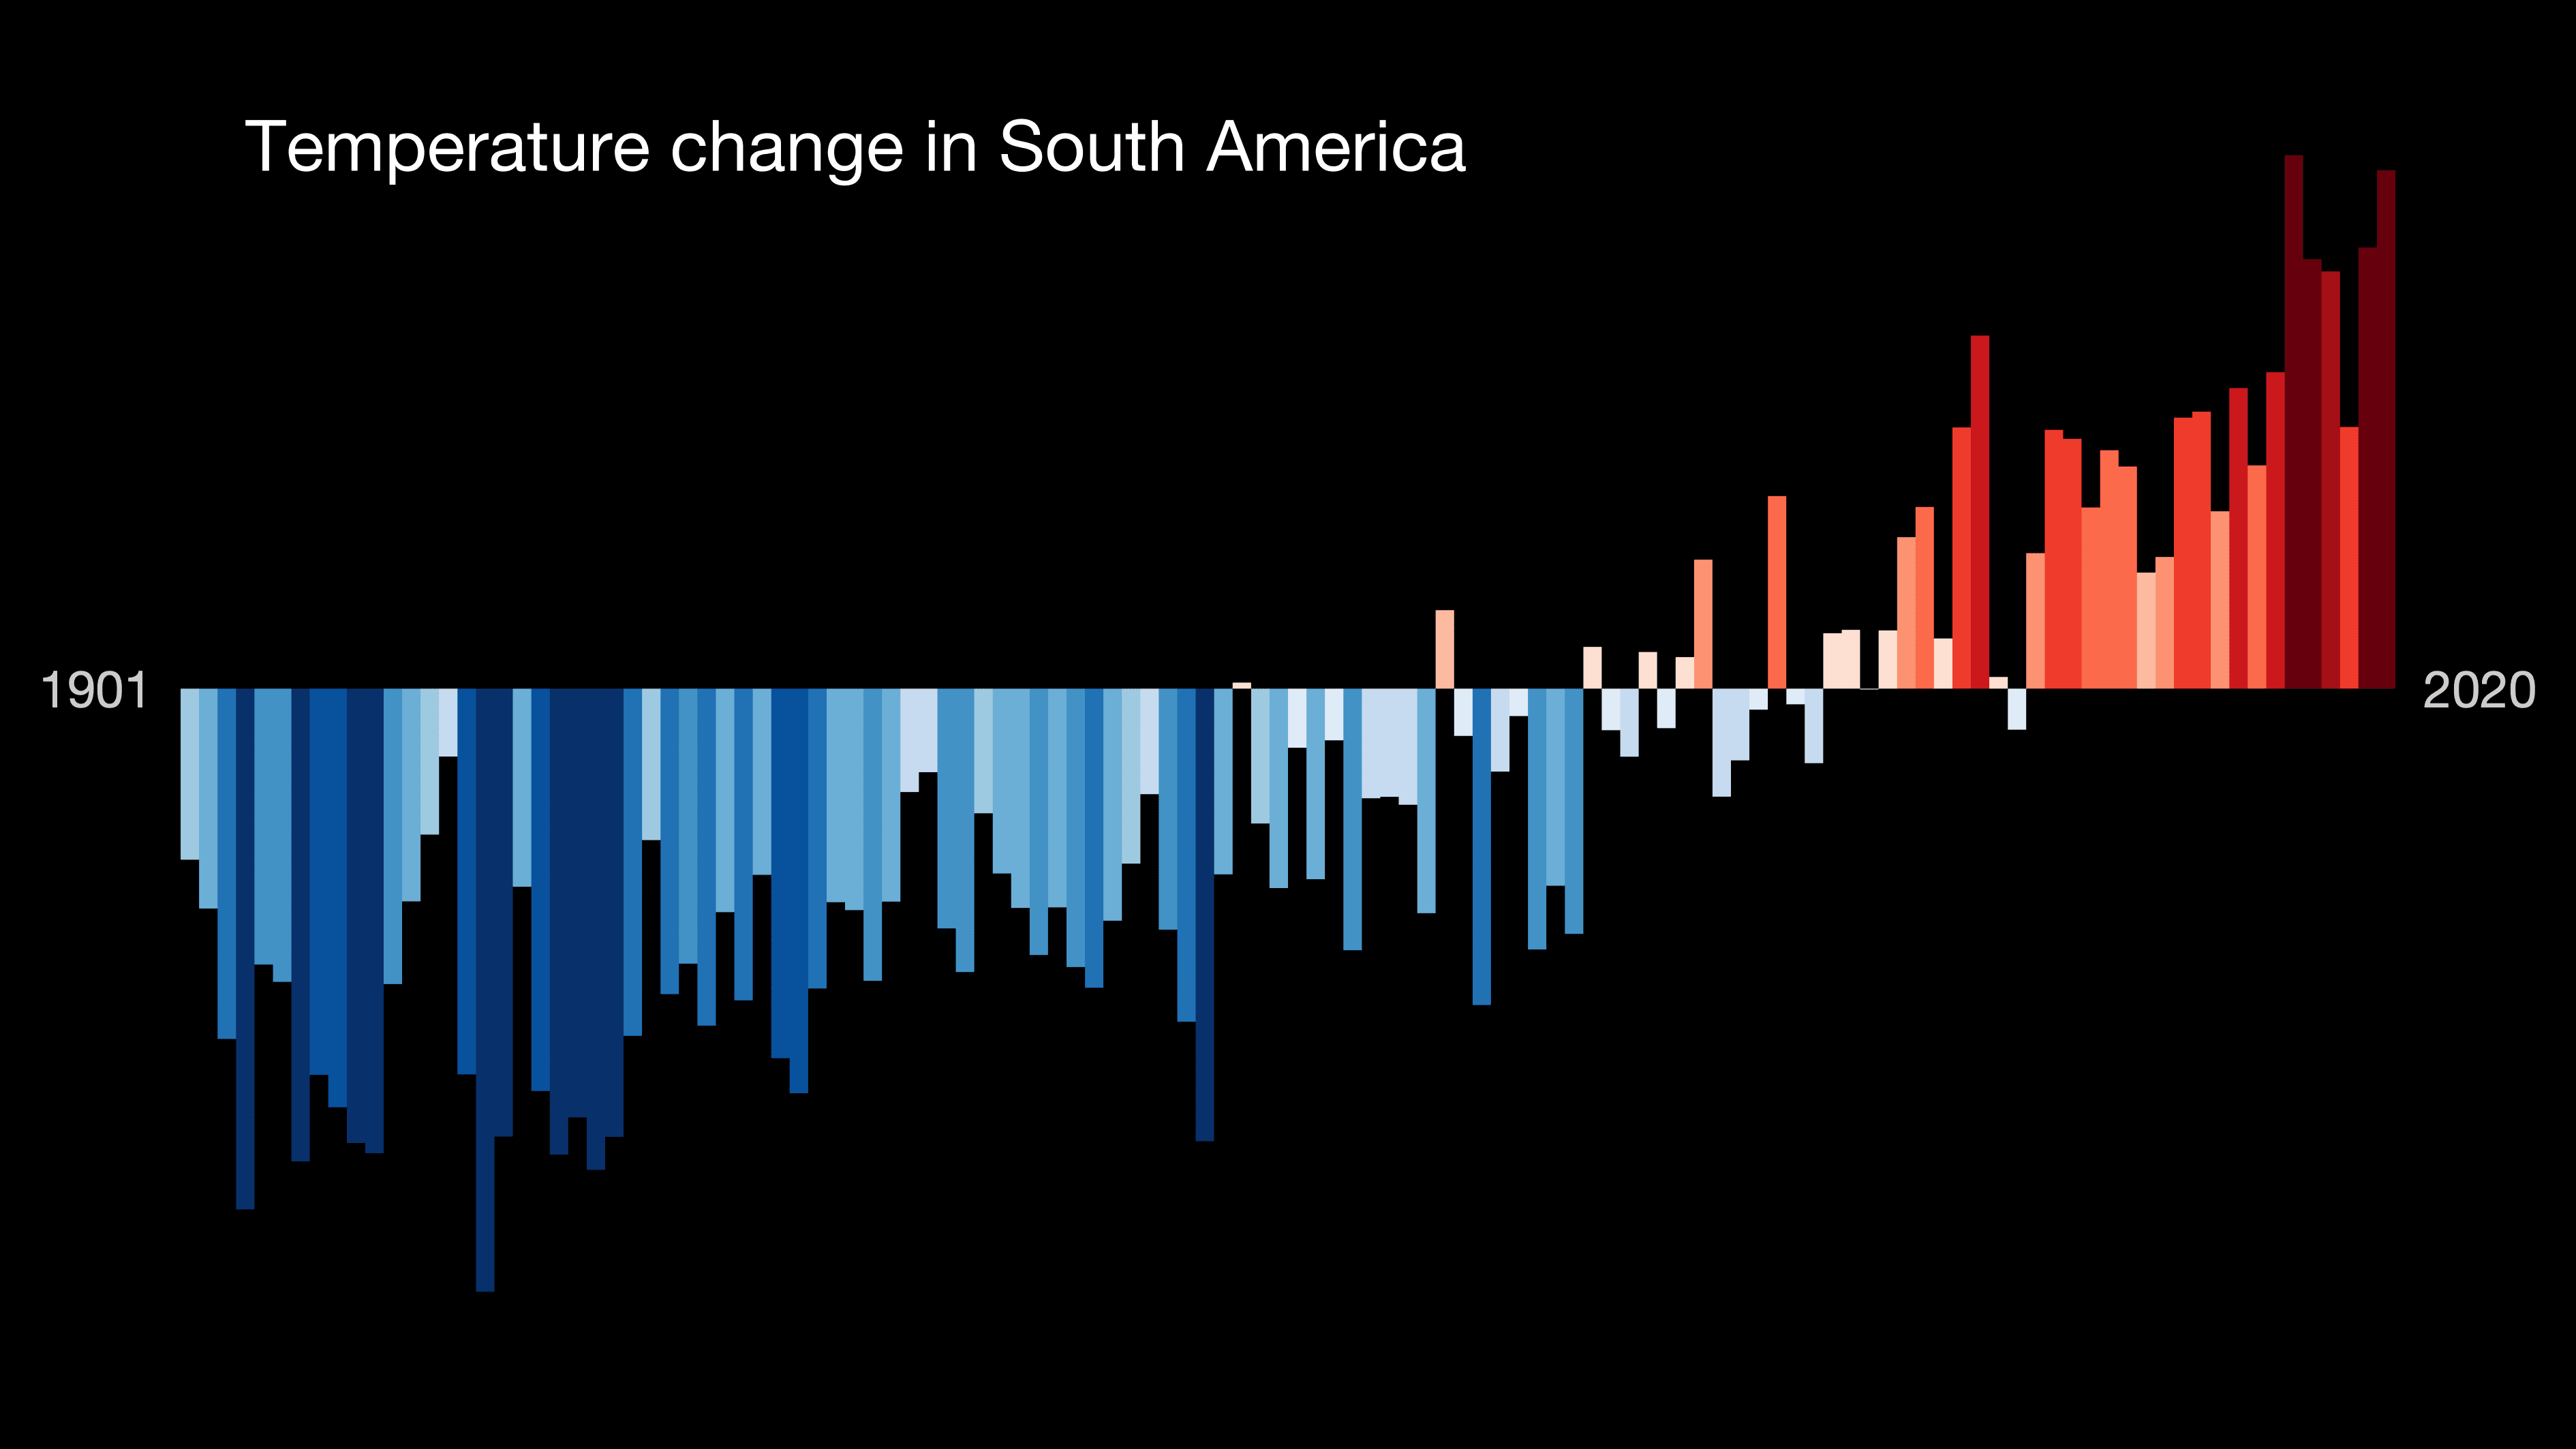
Common for most parts of the world are the deep red bands on the right-hand side, graphically showing how rapidly global temperatures have increased in the recent decades.
The climate stripes, since their release, have had a global impact, with the graphic having been used from the runways at fashion shows to being printed on a Tesla car. The graphic was first used on the main stage of the Reading Festival and continues to be used by campaigners worldwide.
Previously, Hawkins had released a ‘climate spiral’ of global temperature in 2016, which was included in the opening ceremony of the 2016 Olympic ceremony in Rio.
ABOUT ED HAWKINS
Ed Hawkins Climate scientist in the National Centre for Atmospheric Science (NCAS) at the University of Reading. IPCC AR5 Contributing Author.
SUBSCRIBE TO OUR NEWSLETTER
IMAGE GALLERY
SHARE ARTICLE
COMMENTS